

A Spanish version of this article has been published on pybonacci.org.
Since quite some time I wanted to learn Pandas. Finally I grabbed a recent opportunity: Brexit = data.
As usual I started with a practical exercise / objective. I used Pandas to analyze the CSV data published by electoralcommission.org.uk.
Although I wanted to answer more questions, this CSV was enough to get my feet wet with Pandas (it’s huge!). Moreover I learned to use Jupyter notebook to document my progress. You can see / download the notebook at Github.
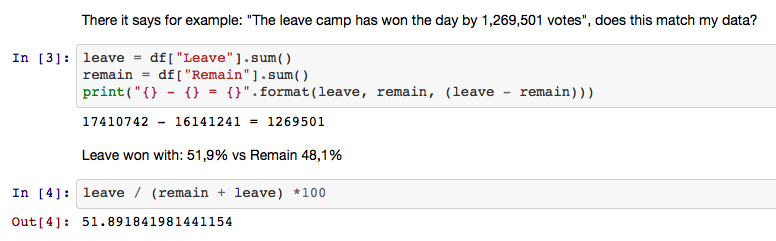
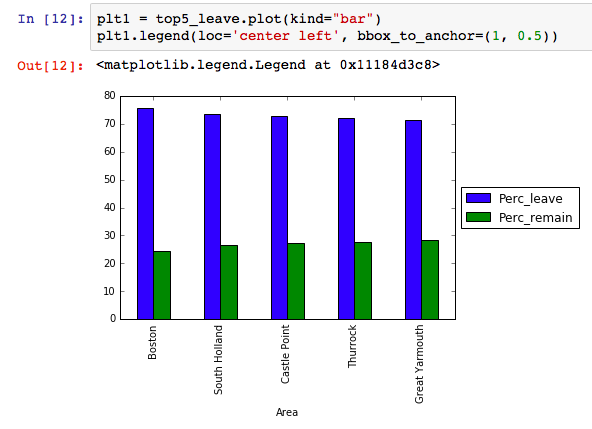
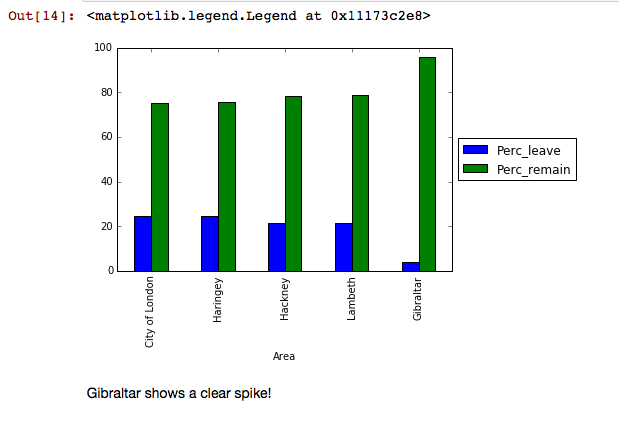
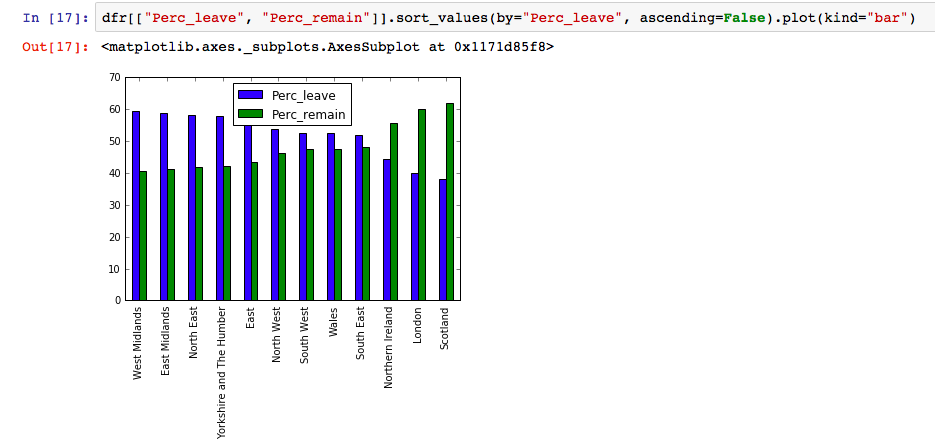
I achieved my goal of representing the data shown here. Here are some screenshots of the notebook:
…
…
…
…
Adding demographics
I matched the data with publicly available census data (as suggested by Pybonacci, thanks). I found some cool correlations (and learned quite some matplotlib along the way), see the full notebook here:
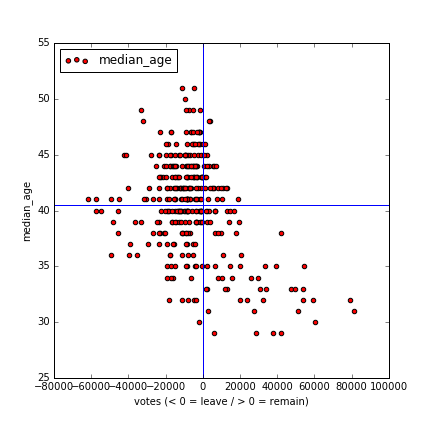
How does age influence the leave / remain vote?
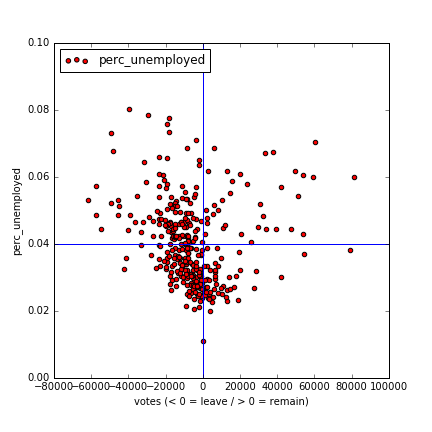
How does unemployment influence?
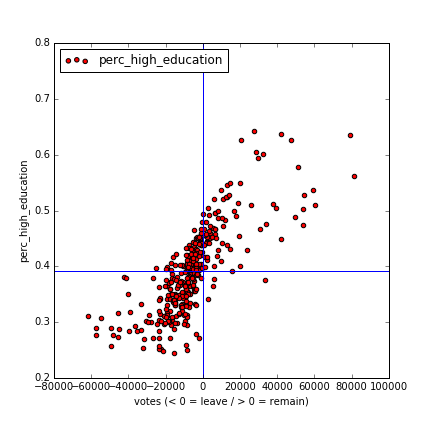
How does higher education influence?
And how does being born outside UK influence?
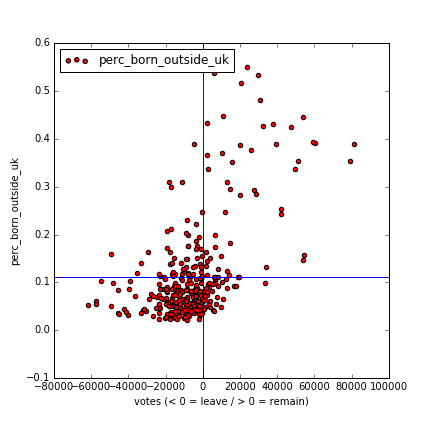
Clearly elderly people and areas with a higher unemployment rate tend to vote for “Leave”. On the other hand, areas with a higher percentage of highly educated people, and regions with more people born outside the UK, (generally) prefer that UK remains in the EU.
Again, to see how I got to these results with Pandas you can see the full notebook here.
And last but not least: income data by region
Income data was harder to get from the standard census data so I used this link to check the relation of median income on voting. I found an interesting pattern:
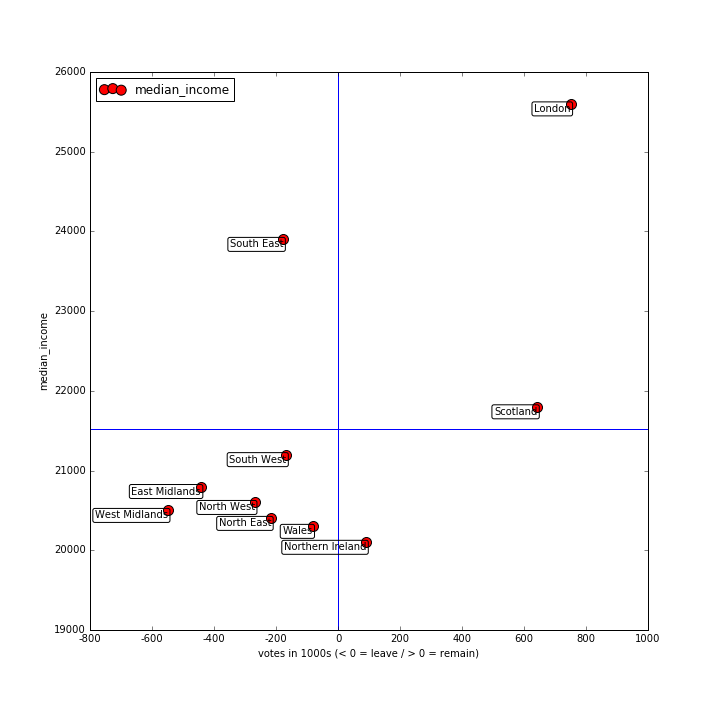
(the parsing of the data is documented in the same notebook)
We can clearly see that regions with a relatively smaller median income are more in favor of leaving the EU, although it is not 100% consistent: Northen Ireland has a lower median income but voted Remain, South East has a higher median income but wants to leave. Interesting though how general trends become visible by merging different data sets.
Reference links to learn Pandas
- Pandas home and docs
- Python’s pandas make data analysis easy and powerful with a few lines of code - short and easy tutorial to start.
- Python for Data Analysis - book by Panda’s creator Wes McKinney.
- Introduction to Pandas for Developers / Data Wrangling and Analysis with Python - I have seen some videos of these courses already, they are pretty good.
- pandas (2) ,
- numpy (1) ,
- matplotlib (2) ,
- brexit (1) ,
- data (2) ,
- analysis (2) ,
- mining (2) ,
- scatterplot (1)
