

In this post I use Google Play Top Charts API (42matters) to analyze top app charts on Google Play. I zoom in on categories and compare Spain with US. What are the top (new) free, (new) paid and grossing categories? And what app categories are trending right now? Lastly I check Pokemon Go’s success by using the Google Play App Rank History API
### Prep work
See the Jupyter notebook here.
If you want to run this analysis yourself (maybe you want to check other countries):
- get a 42 matters API key
- git clone https://github.com/bbelderbos/google_play_top_charts
-
update the config file: notebook.conf
  [vars]
  apikey = <your_api_key>
  country = <your_primary_country> -> I use ES (Spain)
  compare_country = <your_compareTo_country> -> I use US (United States)
  limit = <how_many_top_results> -> I us
I use the awesome requests module to make calls to the API:
    def get_request_url(*args):
        return "https://data.42matters.com/api/v2.0/android/apps/top_google_charts.json?" +\
            "list_name={}&cat_key=OVERALL&country={}&limit={}&access_token={}".format(*args)
In this analysis I zoom in on categories so I made this helper method:
    def get_top_categories_from_response(resp):
        cats = [app["category"] for app in resp["app_list"]]
        cats_count = Counter(cats)
        return dict(cats_count.most_common(5))
This method gets all the data and caches the full responses for later use:
    def get_stats(country):
        for lname in list_names:
            url = get_request_url(lname, country, limit, access_token)
            resp = requests.get(url).json()
            cache[country][lname] = resp
            trends[country][lname] = get_top_categories_from_response(resp)
This calls the API for ES and US, for all list names (run this once, it will take some API calls!):
    for co in (country, compare_country):
        get_stats(co)
I write the data to CSV to load it into Pandas:
    for co in (country, compare_country):
        writer = csv.writer(open('cache_%s.csv' % co, 'w'))
        for key, value in cache[co].items():
            for app in value["app_list"]:
                writer.writerow(app.values())
Data in Pandas and plot
The data looks like this:
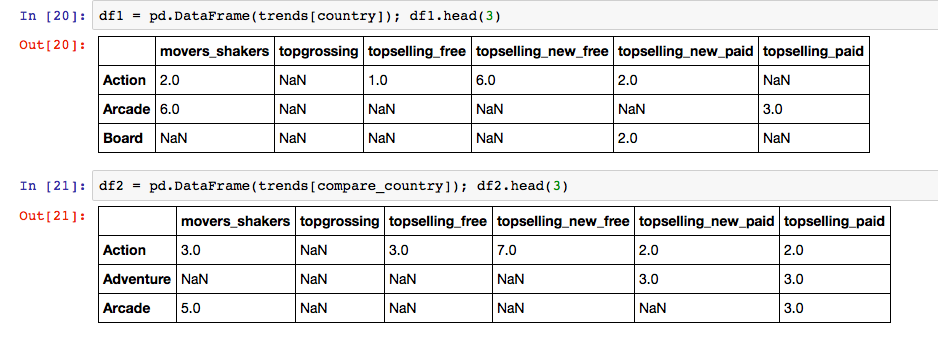
Now we can plot the data:
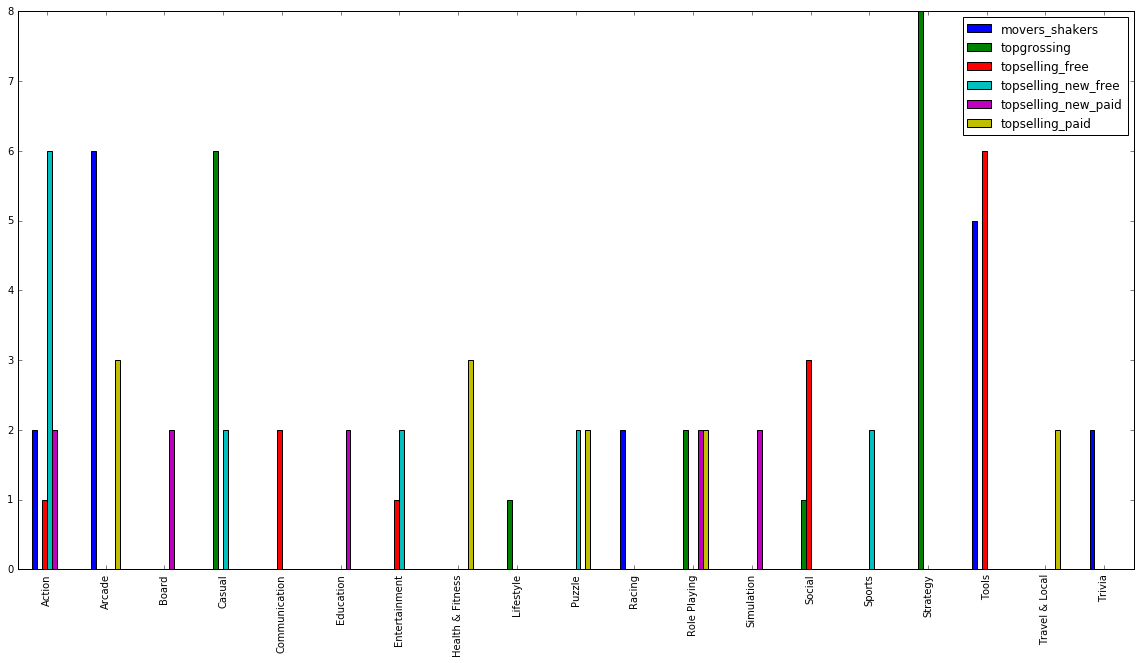
    plt1 = df1.plot(kind="bar")
    fig = matplotlib.pyplot.gcf()
    fig.set_size_inches(20, 10)
(all this is in the notebook)
Spanish app market by app category:
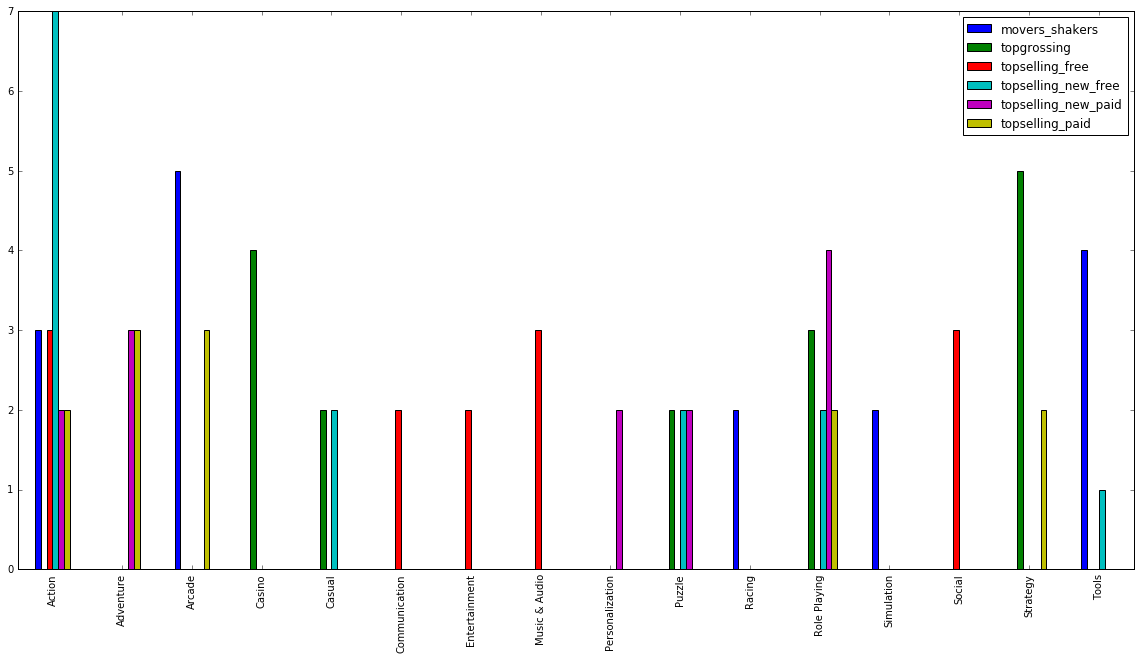
US app market by app category:
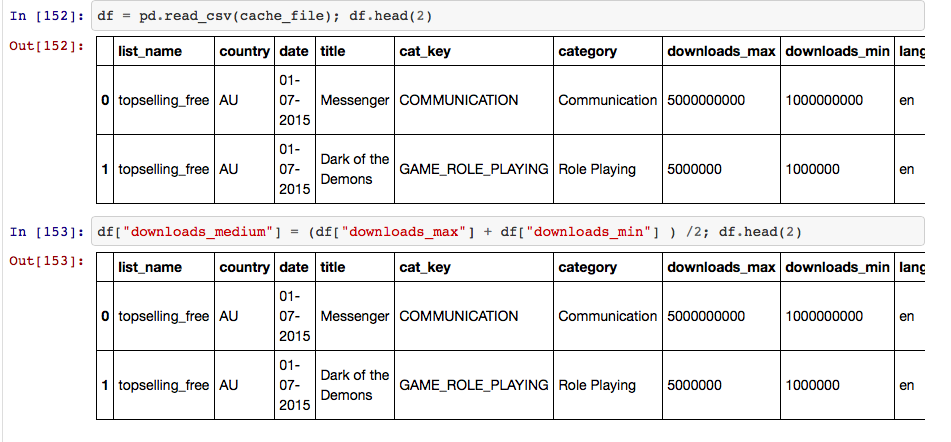
### Look at number of downloads
Another approach is to look at the number of downloads. The API has min and max download numbers so best to take the average. See this notebook (in progress). I compare the Android app market in Australia, Chile, China, Spain, Netherlands and US.
Again we store the data to not make a lot of API calls:
    def store_response(resp, writeHeader=False):
        list_name = resp["list_name"]
        country = resp["country"]
        date = resp["date"]
        with open(cache_file, 'a') as csvfile:
            writer = csv.DictWriter(csvfile, fieldnames=fieldnames)
            if writeHeader:
                writer.writeheader()
            for app in resp["app_list"]:
                writer.writerow({'list_name': list_name, 'country': country, 'date': date,
                                'title': app["title"], 'cat_key': app["cat_key"],
                                'category': app["category"],
                                'downloads_max': app["downloads_max"],
                                'downloads_min': app["downloads_min"],
                                'lang': app["lang"], 'rating': app["rating"]})

    # !! hits = 2 dates x 3 list_names x 6 countries x 3 units per call = 108
    # hence checking if csv file is there and only if not there running this
    if not os.path.isfile(cache_file):
        writeHeader = True
        for date in dates:
            for lname in list_names:
                for country in countries:
                    try:
                        resp = get_response(lname, country, date)
                        store_response(resp, writeHeader)
                        writeHeader = False
                    except:
                        print("ERROR: could not store response for date %s, \
                            list_name %s, country %s" % \
                            (date, lname, country))
The data looks like this. Pandas lets me conveniently calculate the medium downloads:
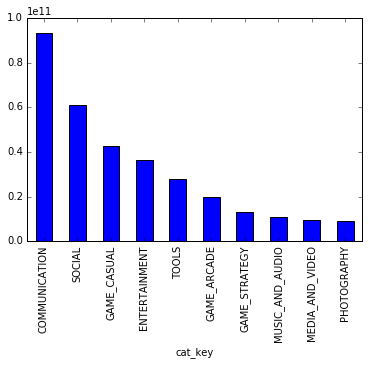
It is easy to make a pivot table in Pandas, followed by a graph. This clearly shows that Communication and Social apps are the most downloaded:
    pd.set_option('display.float_format', lambda x: '%.3f' % x)
    table = pd.pivot_table(df, values='downloads_medium', index=['cat_key'], columns=['country'], aggfunc=np.sum)
    table["total"] = table[list(countries)].sum(axis=1)
    table["total"].sort_values(ascending=False).head(10).plot(kind="bar")
Look at rankings of Pokemon Go
Finally I will use Google Play App Rank History API to show how Pokemon Go is completely kicking ass!
I don’t have a notebook for this one yet, but I show you some small utilities you can use to get started. I use the same notebook.conf to store and retrieve the API key. The endpoint is defined as RANKS_EP with value https://data.42matters.com/api/v2.0/android/apps/ranks.json?
I defined some helpers:
    def read_json(fname):
        json_data=open(fname).read()
        return json.loads(json_data)
    RANKS_EP = "https://data.42matters.com/api/v2.0/android/apps/ranks.json?"

    def get_key():
        with open("notebook.conf") as f:
            return [line.split("=")[1].strip() for line in f.readlines() if "apikey" in line][0]

    def get_ranks(package, days=10, cache=True):
        params = {
            "p": package,
            "days": days,
            "access_token": get_key(),
        }
        r = requests.get(RANKS_EP, params=params)
        if cache:
            fname = package + "_rank.json"
            with open(fname, 'w') as outfile:
                json.dump(r.json(), outfile)
        else:
            return r.json()
I use that to get all ranking data and save them to package_rank.json output files for analysis. Again this is a caching mechanism to avoid repetitive API calls:
query_api.py cont’d
    if __name__ == "__main__":
        for package in topapps():
            get_ranks(package=package, days=18, cache=True)
Note that topapps is another helper to get the top x package names:
def topapps():
    return [app["package_name"] for app in read_json("topgooglecharts.json")["app_list"]]
You can get (cached) topgooglecharts.json here
I can now compare Pokemon Go with for example Facebook and Snapchat for the last 10 days:
    from pprint import pprint as pp
    from read_json import read_json

    LIST_NAMES = ("topselling_free", "topselling_paid", "movers_shakers",
        "topgrossing", "topselling_new_free", "topselling_new_paid", )

    def get_ranking(package_json, country, list_name):
        data = read_json(package_json)
        for r in data["ranks"]:
            if r["country"] == country and r["list_name"] == list_name:
                return r["positions"]

    def count_top_position(ranking):
        days_top = 0
        for day in ranking:
            if day["position"] and day["position"] == 1:
                days_top += 1
        return days_top

    if __name__ == "__main__":
        for co in ("ES", "US", "AU", "NL"):
            print "\n" + co
            for p in ("com.facebook.katana", "com.nianticlabs.pokemongo", "com.snapchat.android" ):
                print "\n-" + p
                for ln in LIST_NAMES:
                    inp = p + "_rank.json"
                    ranking = get_ranking(package_json=inp, country=co, list_name=ln)
                    if ranking:
                        print ln + " => " + str(count_top_position(ranking))
Output = count of number of days app is first in rank, per country:
    ES

    -com.facebook.katana
    topselling_free => 0
    movers_shakers => 0

    -com.nianticlabs.pokemongo
    topselling_free => 3
    movers_shakers => 4
    topgrossing => 0
    topselling_new_free => 3

    -com.snapchat.android
    topselling_free => 0
    movers_shakers => 0

    US

    -com.facebook.katana
    topselling_free => 0
    movers_shakers => 0

    -com.nianticlabs.pokemongo
    topselling_free => 11
    movers_shakers => 5
    topgrossing => 11
    topselling_new_free => 12

    -com.snapchat.android
    topselling_free => 0
    movers_shakers => 0

    AU

    -com.facebook.katana
    topselling_free => 0
    movers_shakers => 0

    -com.nianticlabs.pokemongo
    topselling_free => 13
    movers_shakers => 4
    topgrossing => 11
    topselling_new_free => 13

    -com.snapchat.android
    topselling_free => 0
    movers_shakers => 0

    NL

    -com.facebook.katana
    topselling_free => 0

    -com.nianticlabs.pokemongo
    topselling_free => 3
    movers_shakers => 3
    topgrossing => 4
    topselling_new_free => 3

    -com.snapchat.android
    topselling_free => 0
    movers_shakers => 2
I have to yet plot this or maybe not needed, this clearly shows Pokemon Go is consistently at the top now, pretty impressive!
- pandas (2) ,
- matplotlib (2) ,
- googleplay (1) ,
- data (2) ,
- analysis (2) ,
- mining (2) ,
- apps (1) ,
- 42matters (1) ,
- APIs (9)
